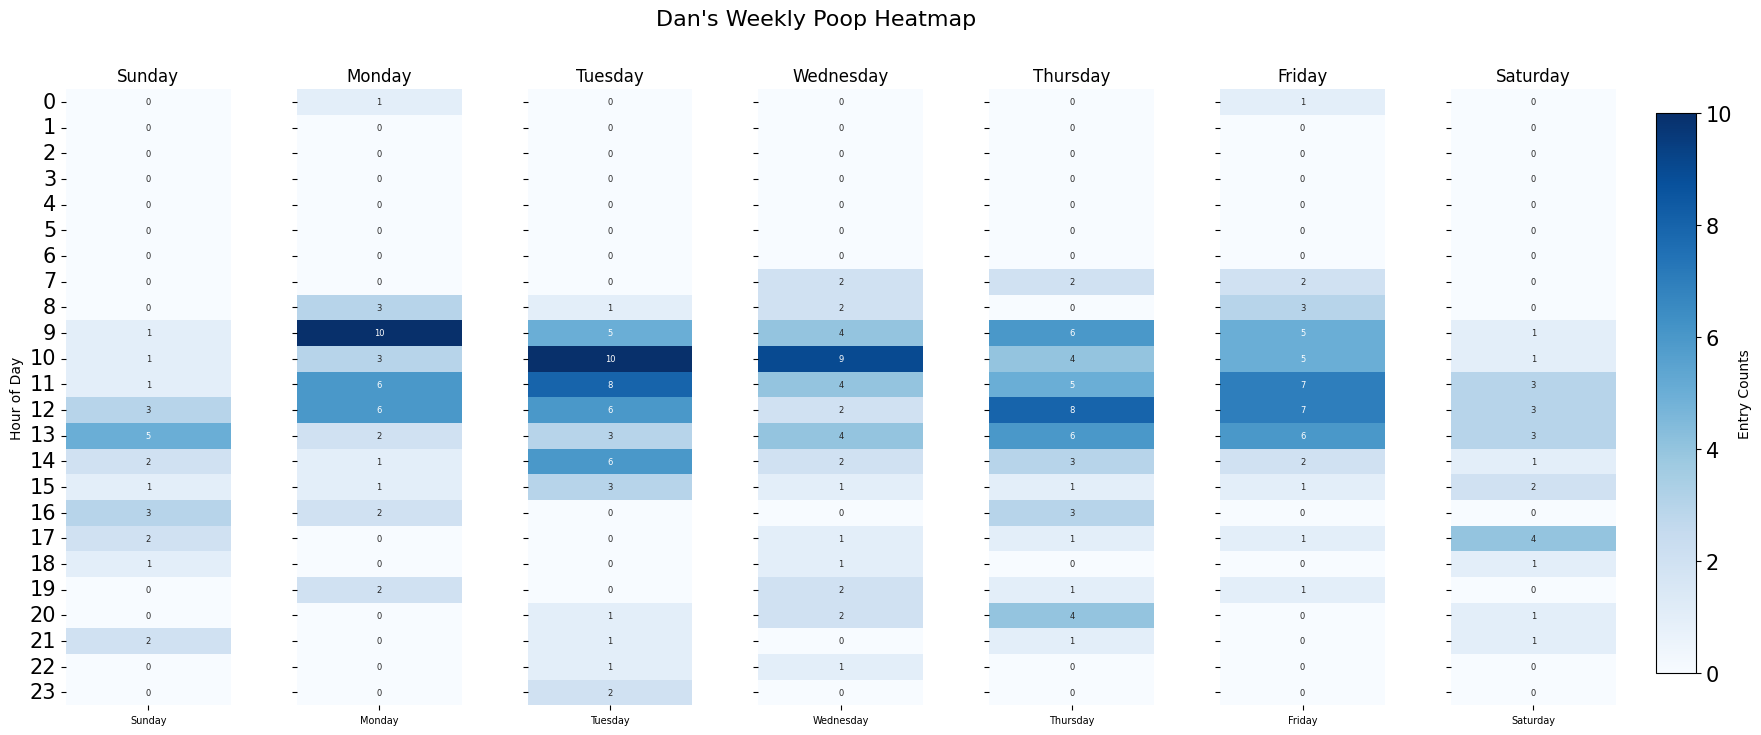
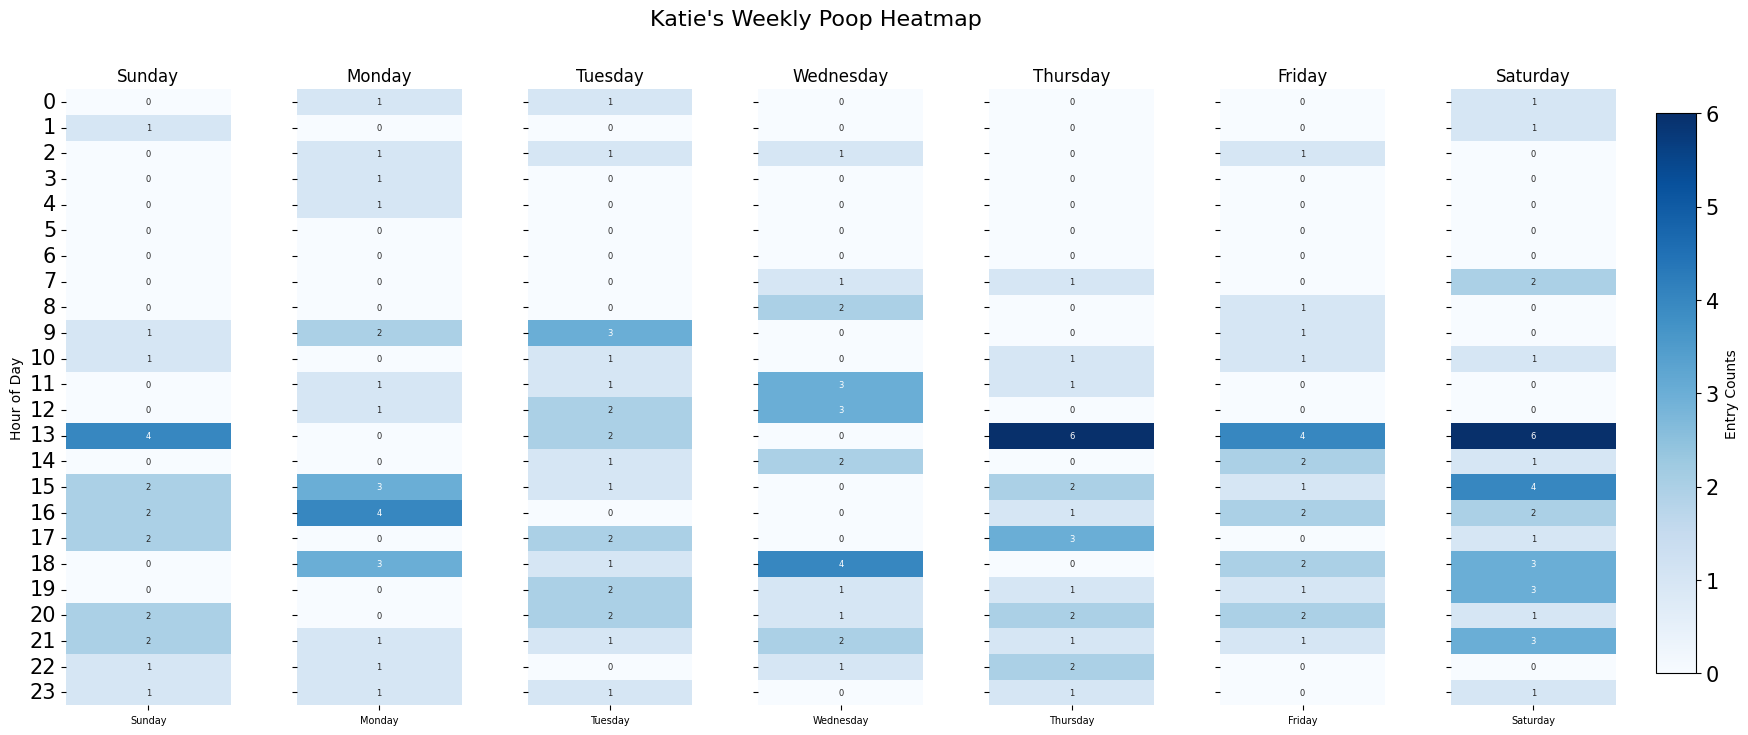
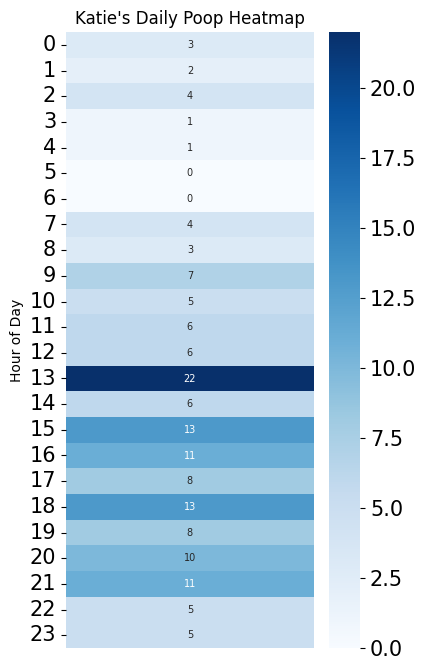
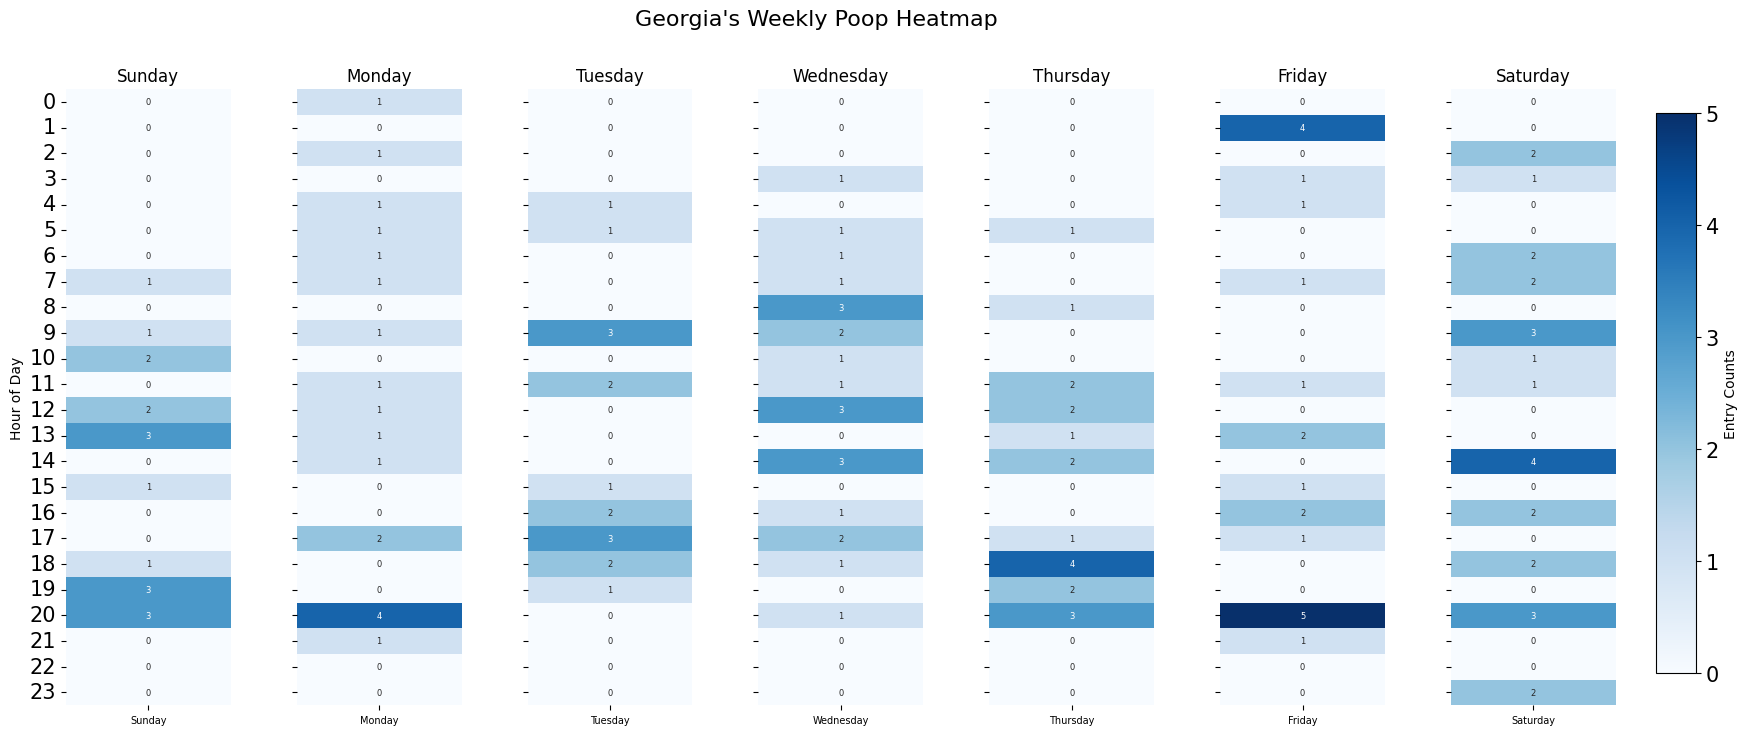
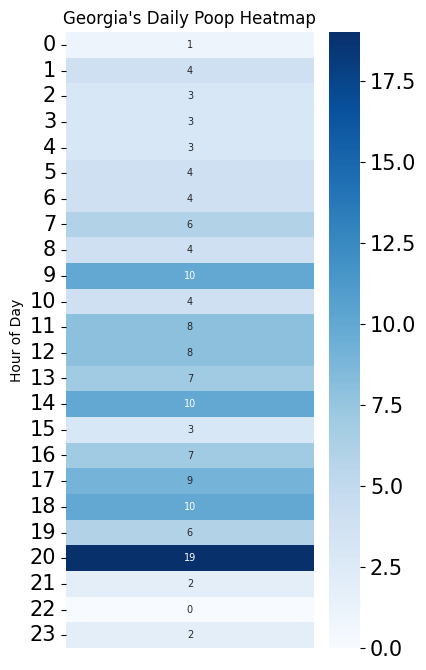
Group Heatmaps
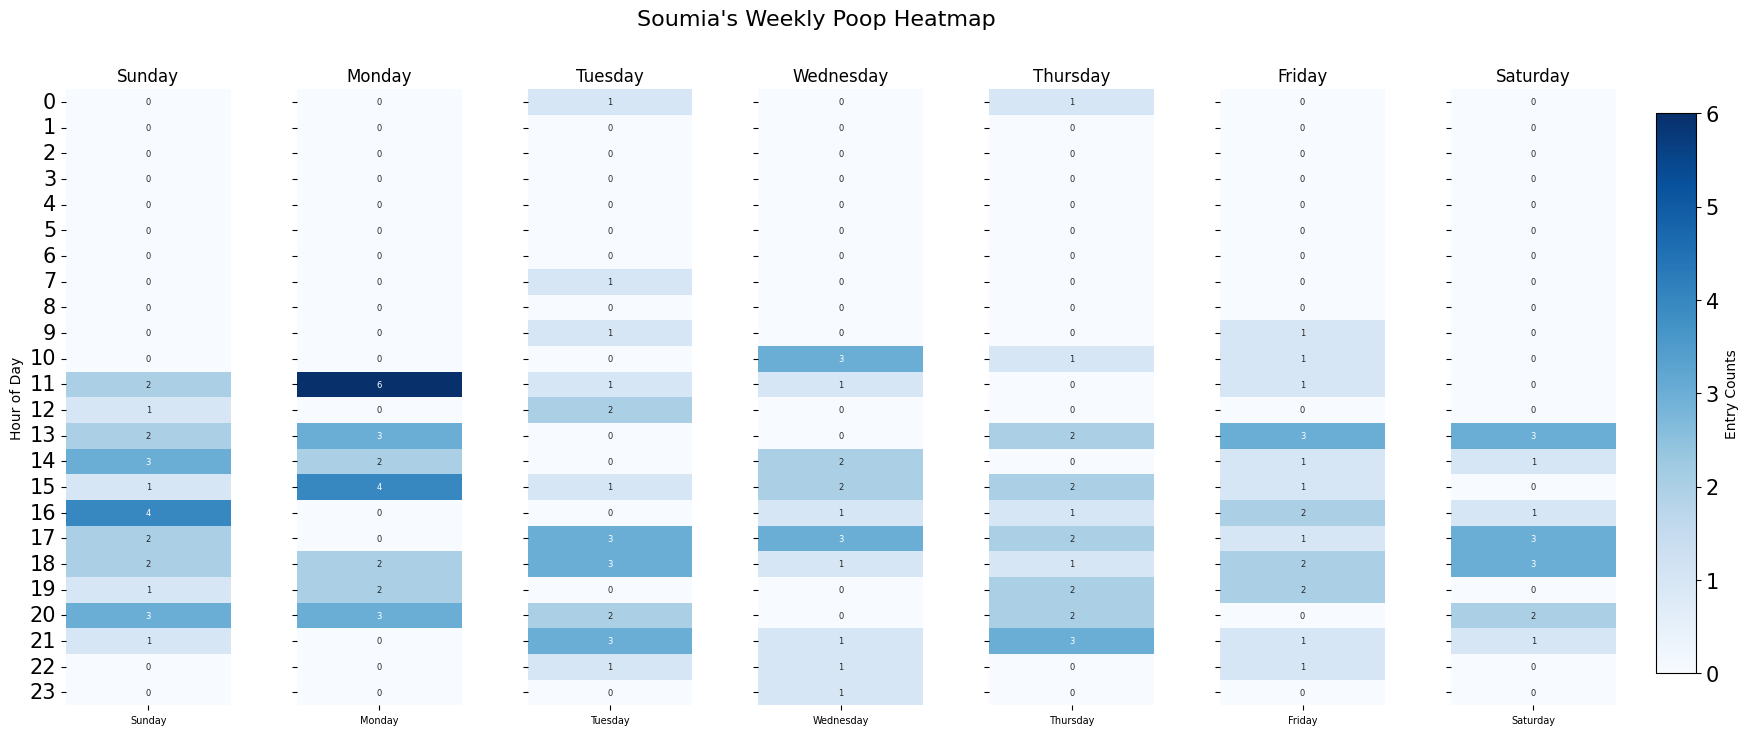
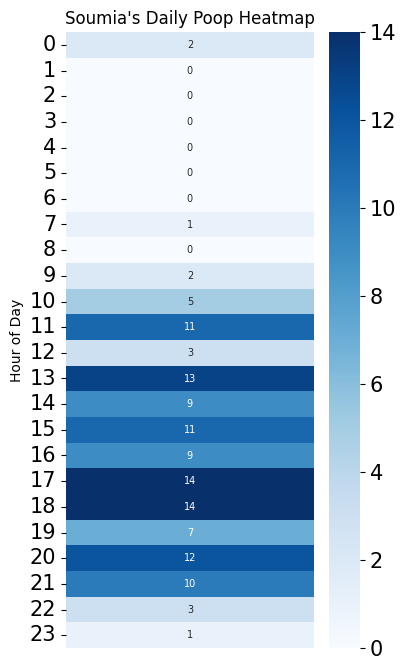
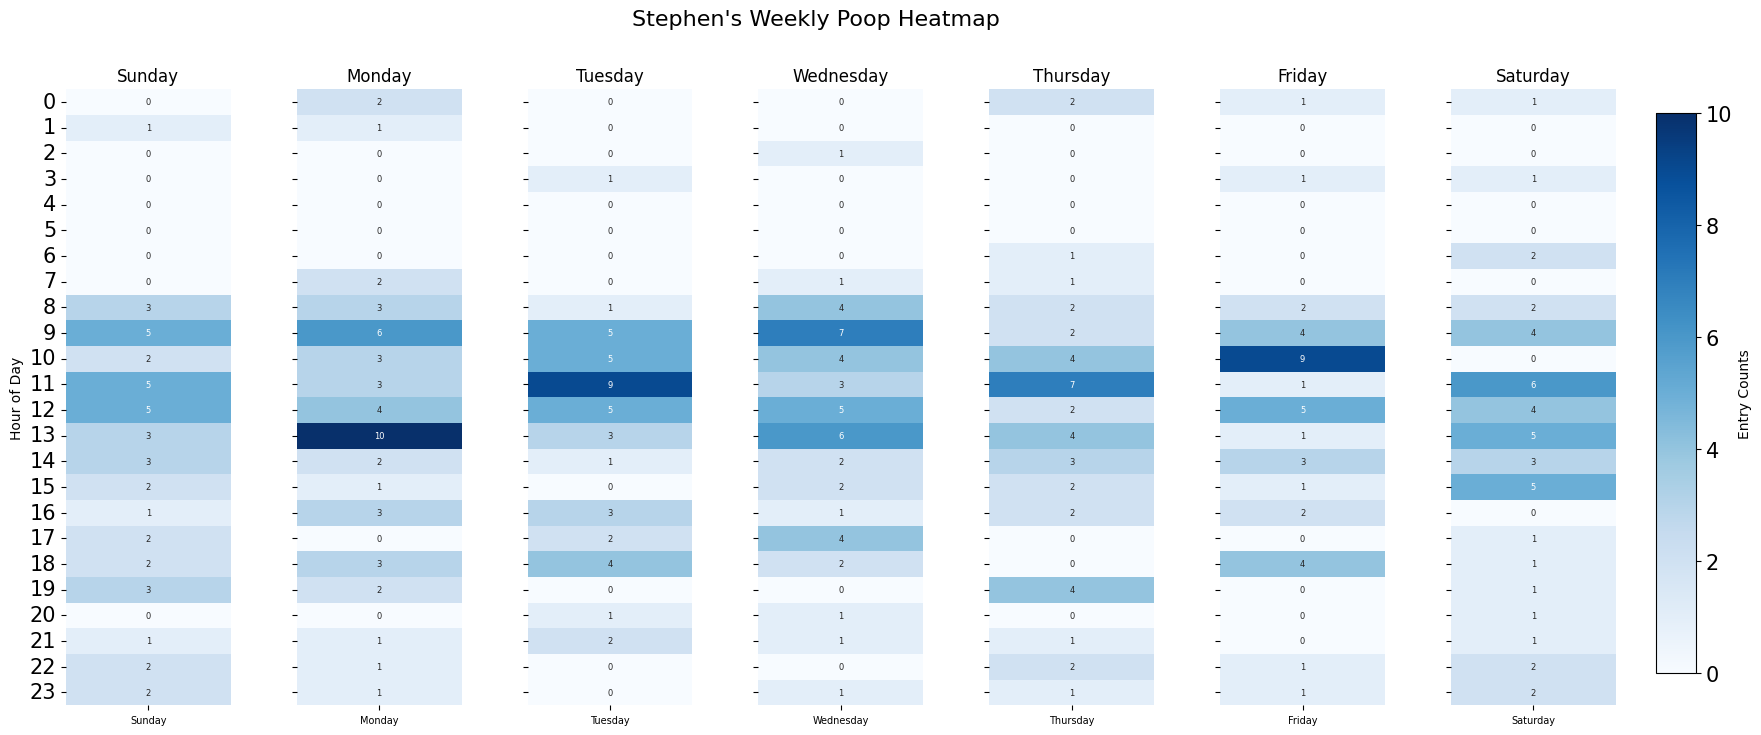
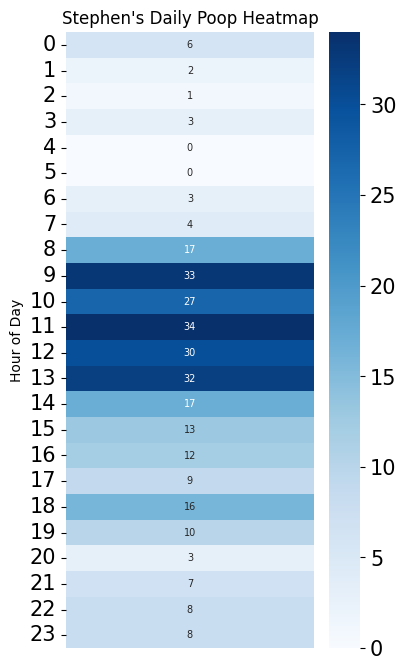
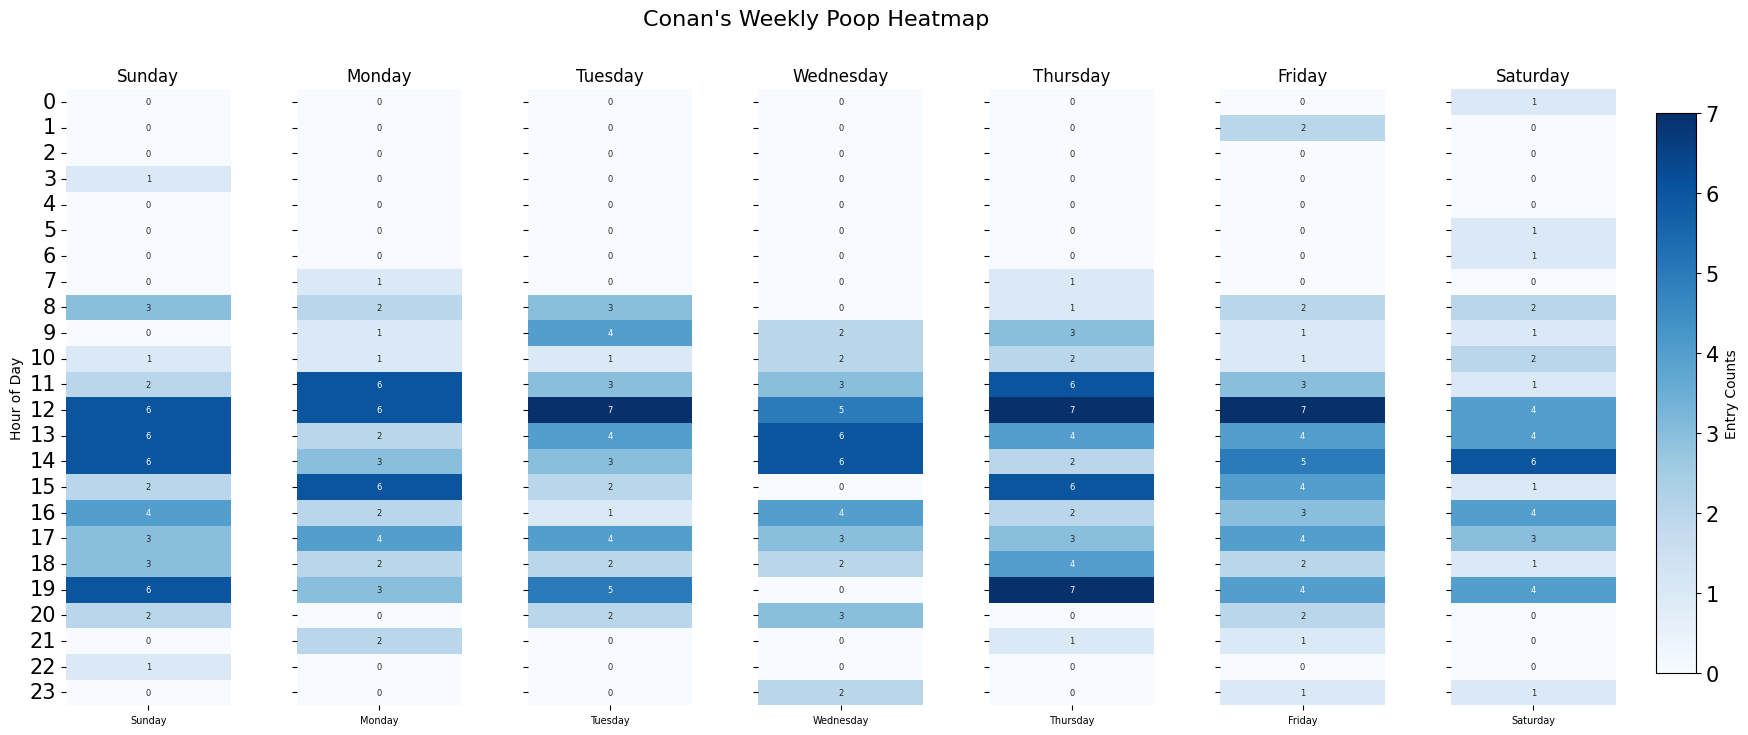
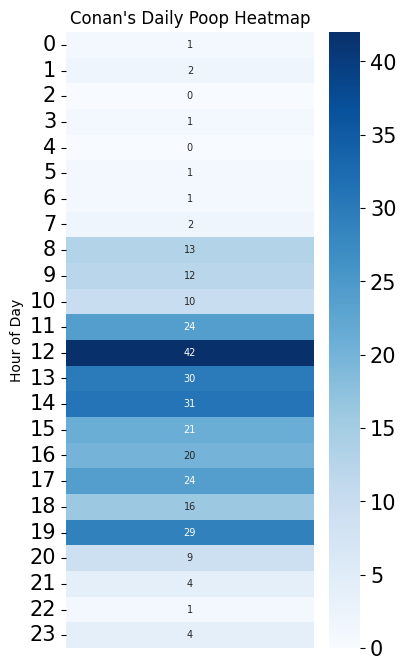
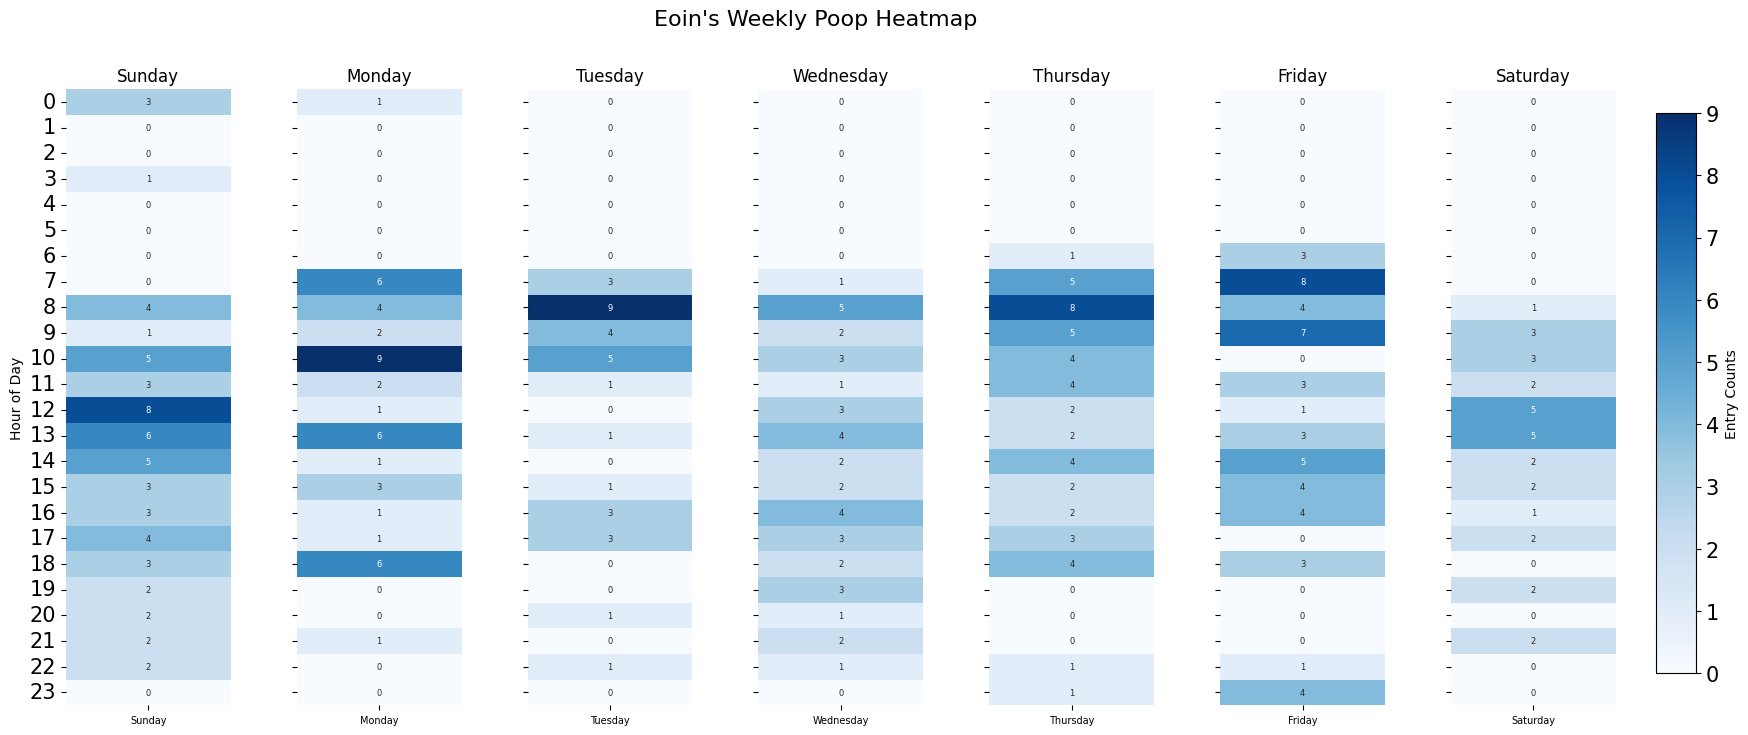
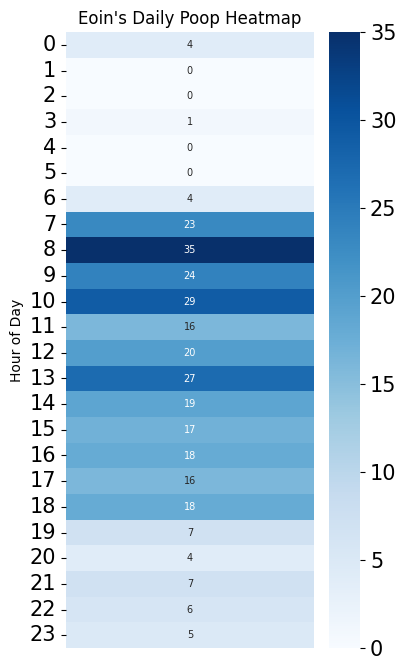
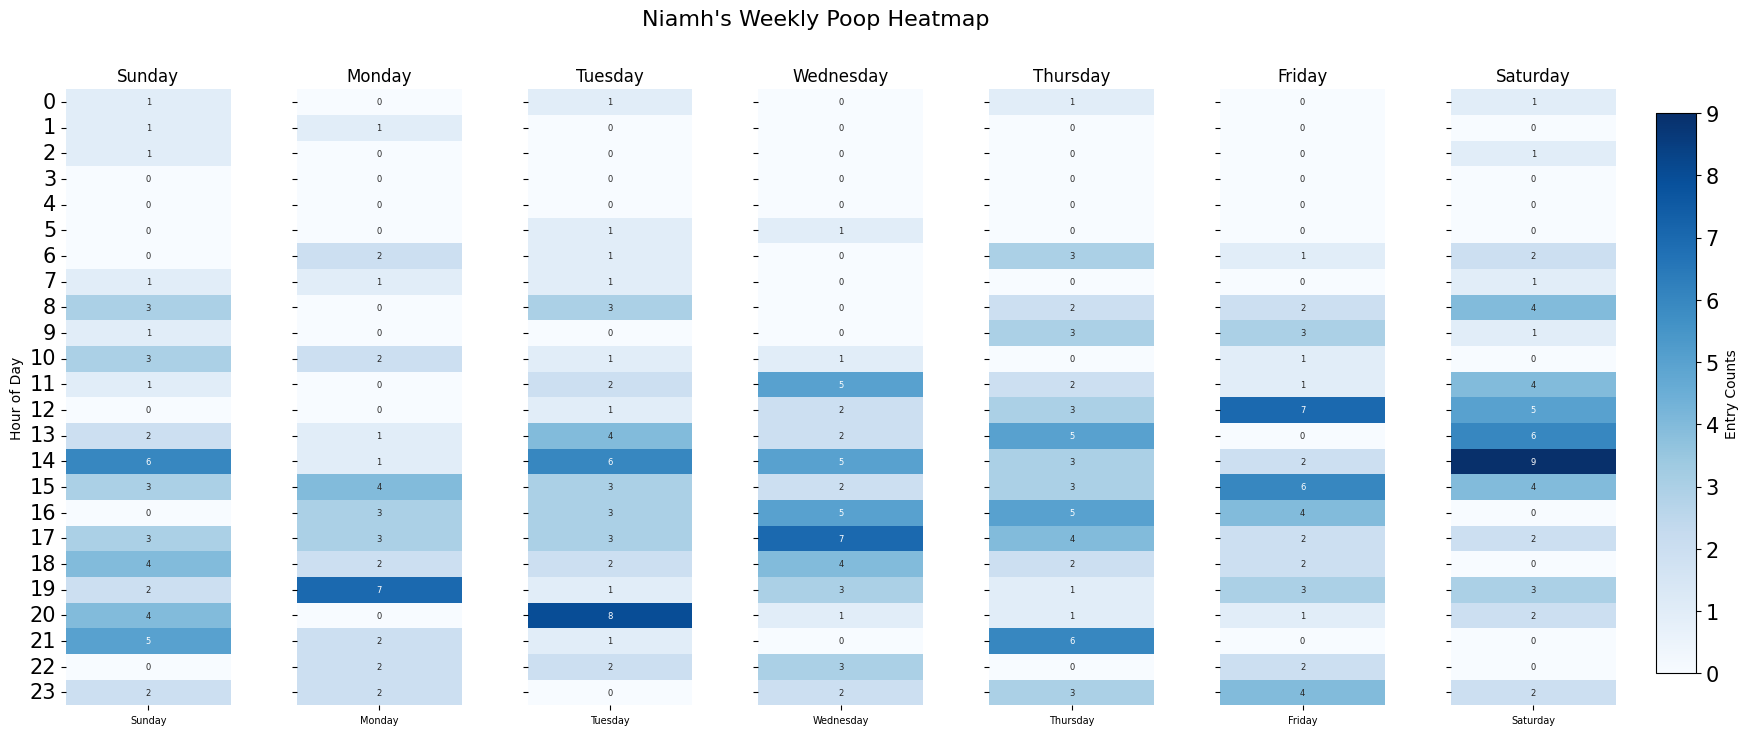
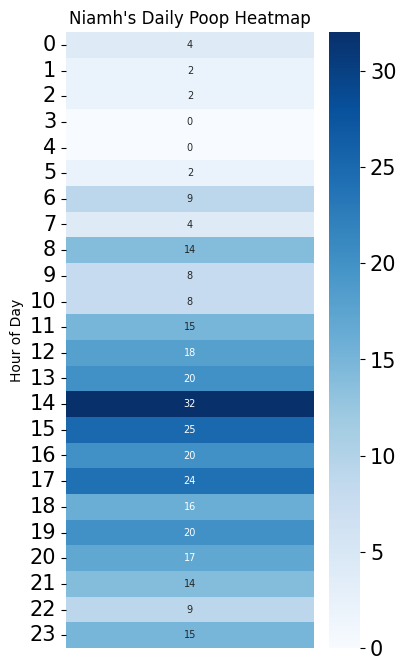
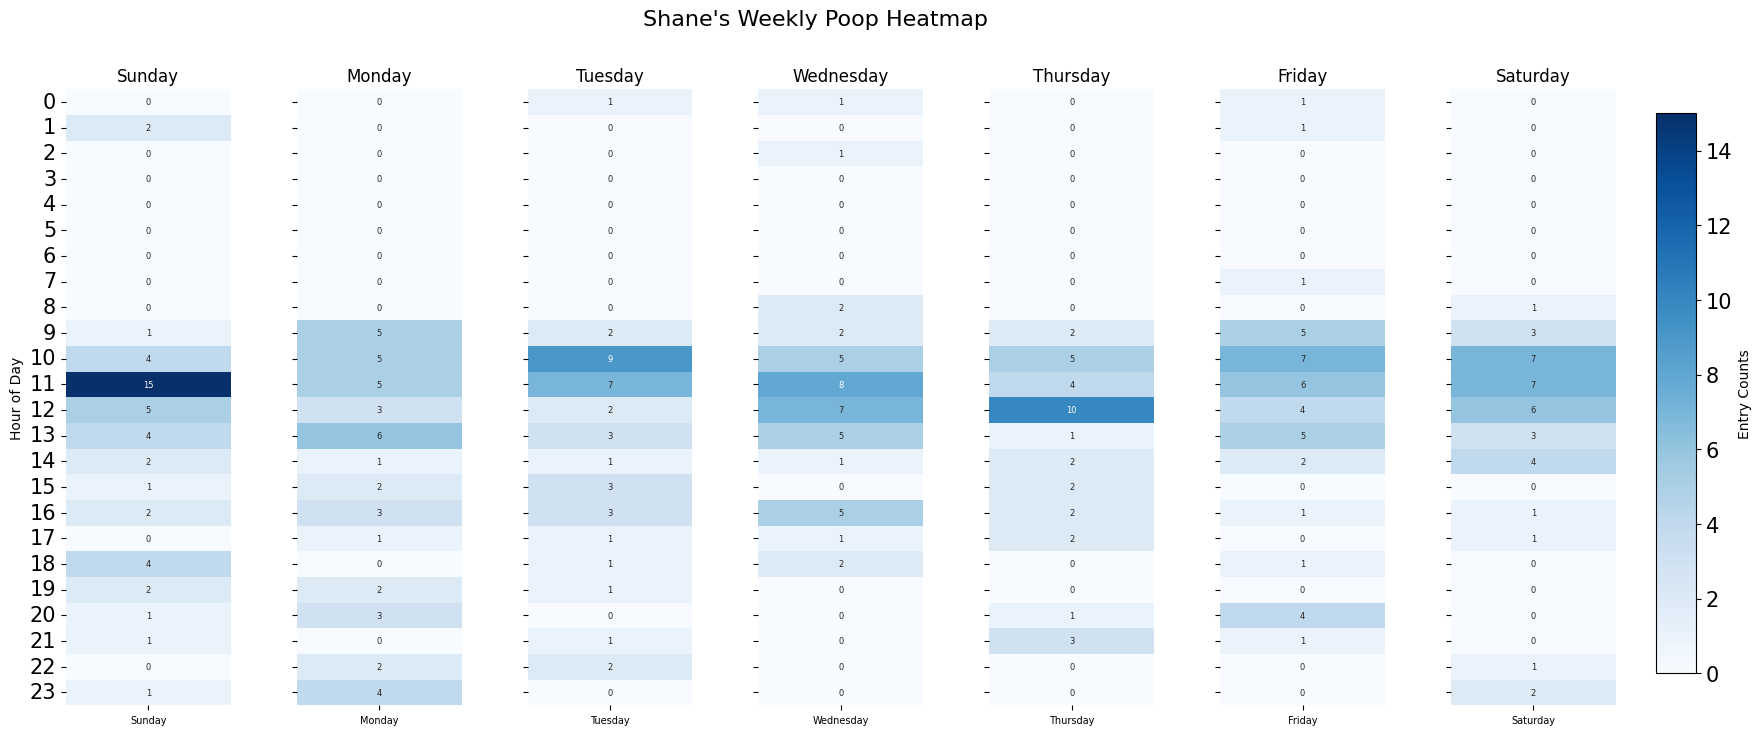
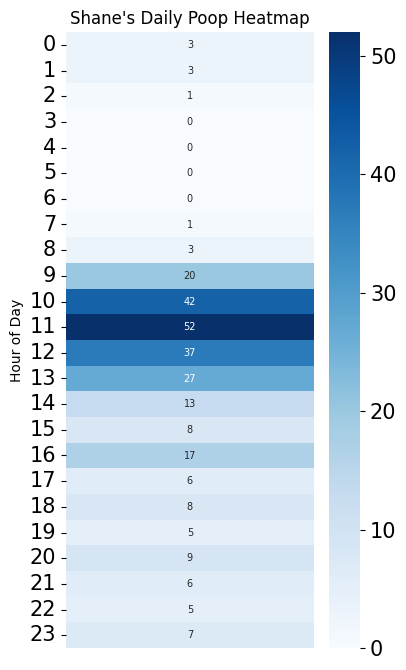
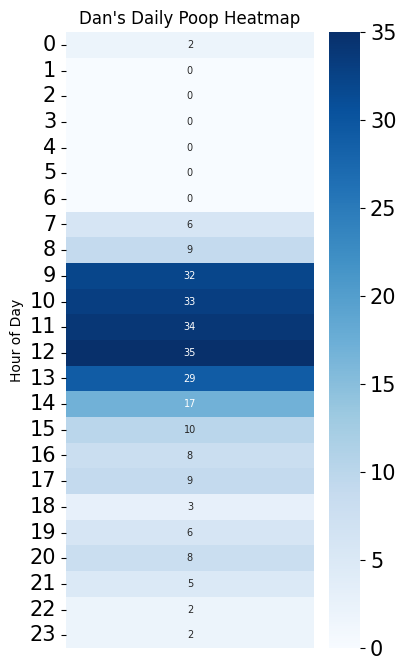
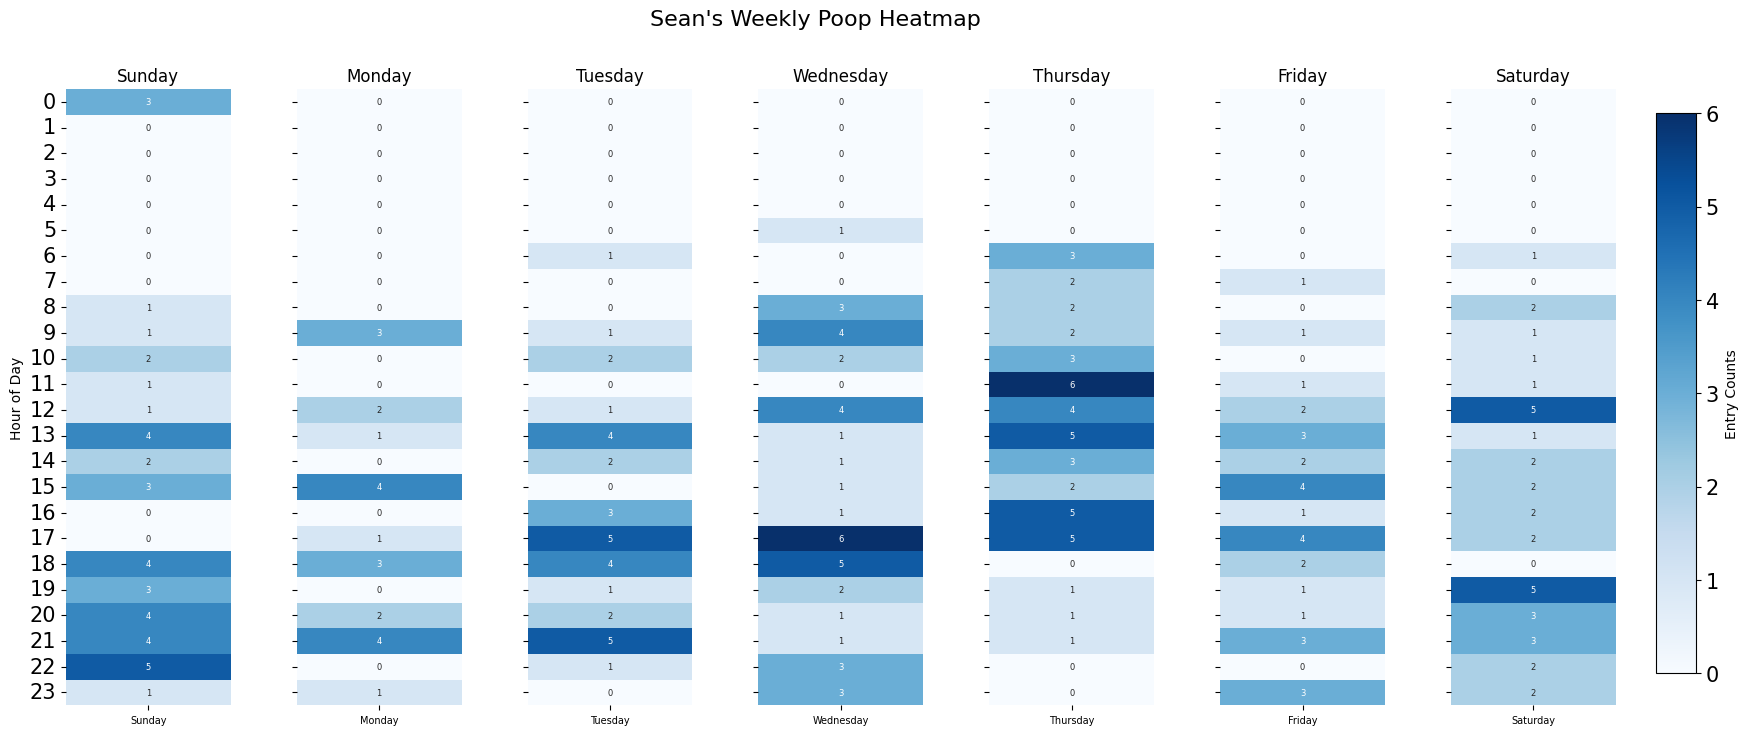
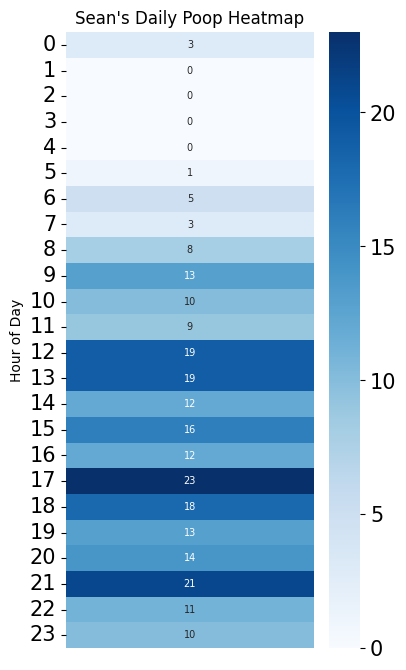
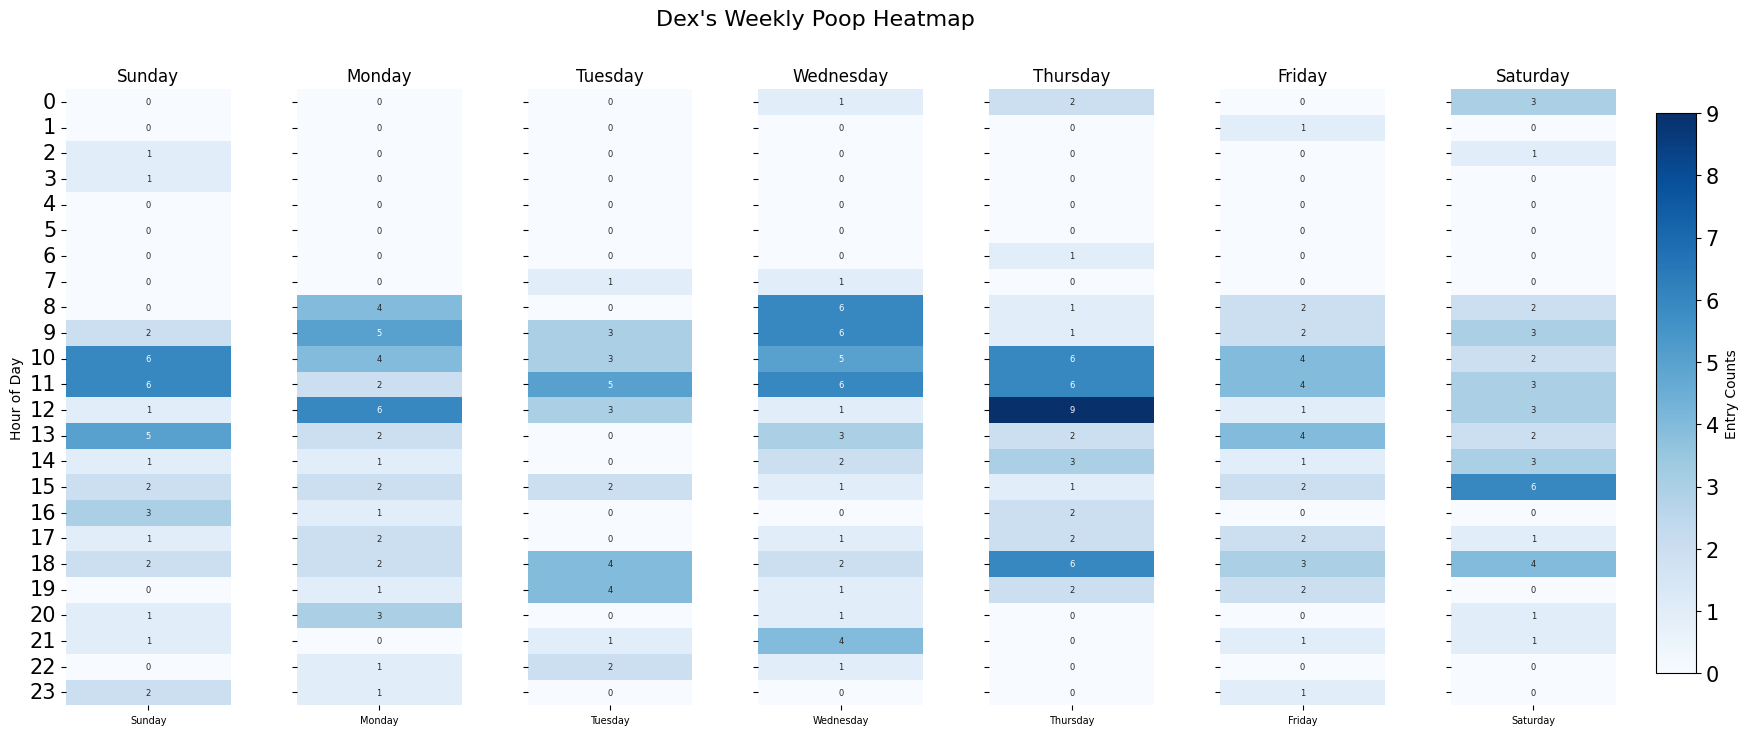
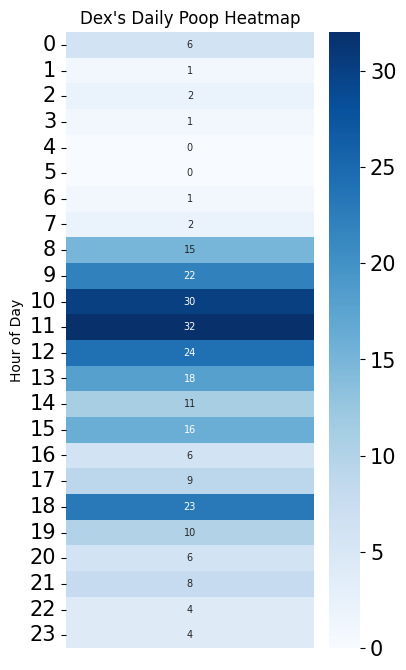
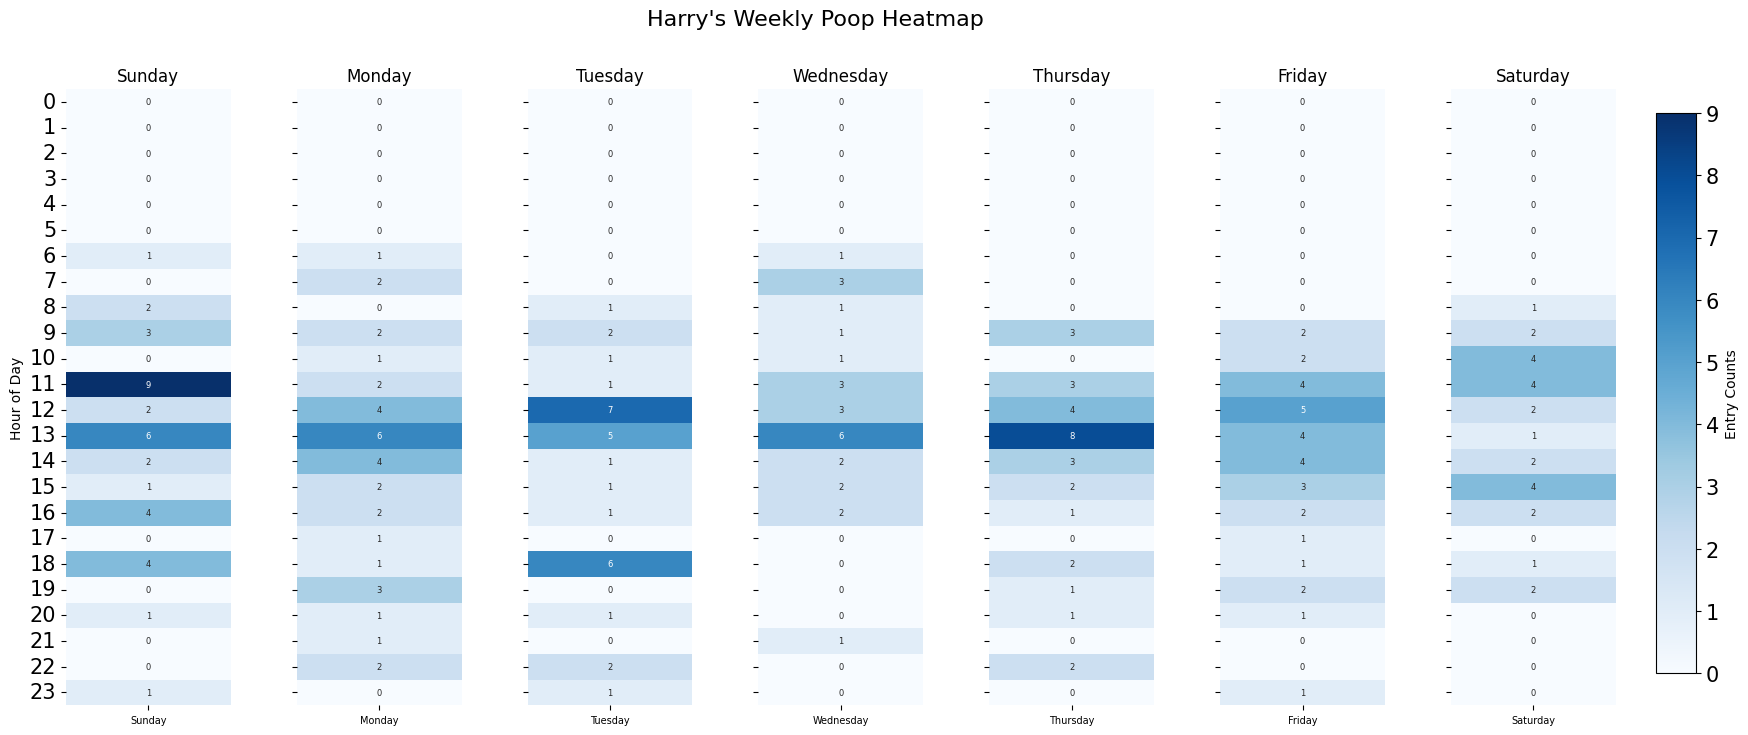
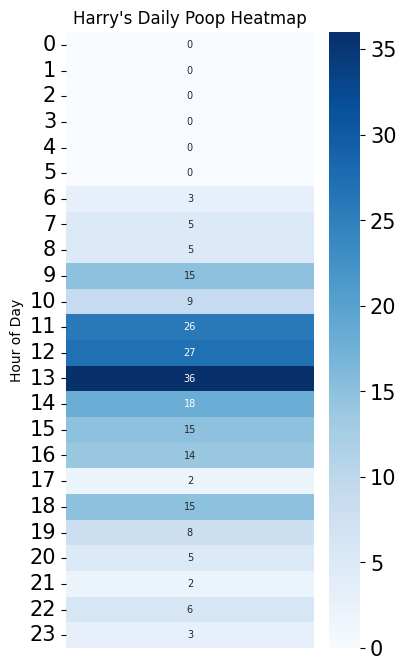
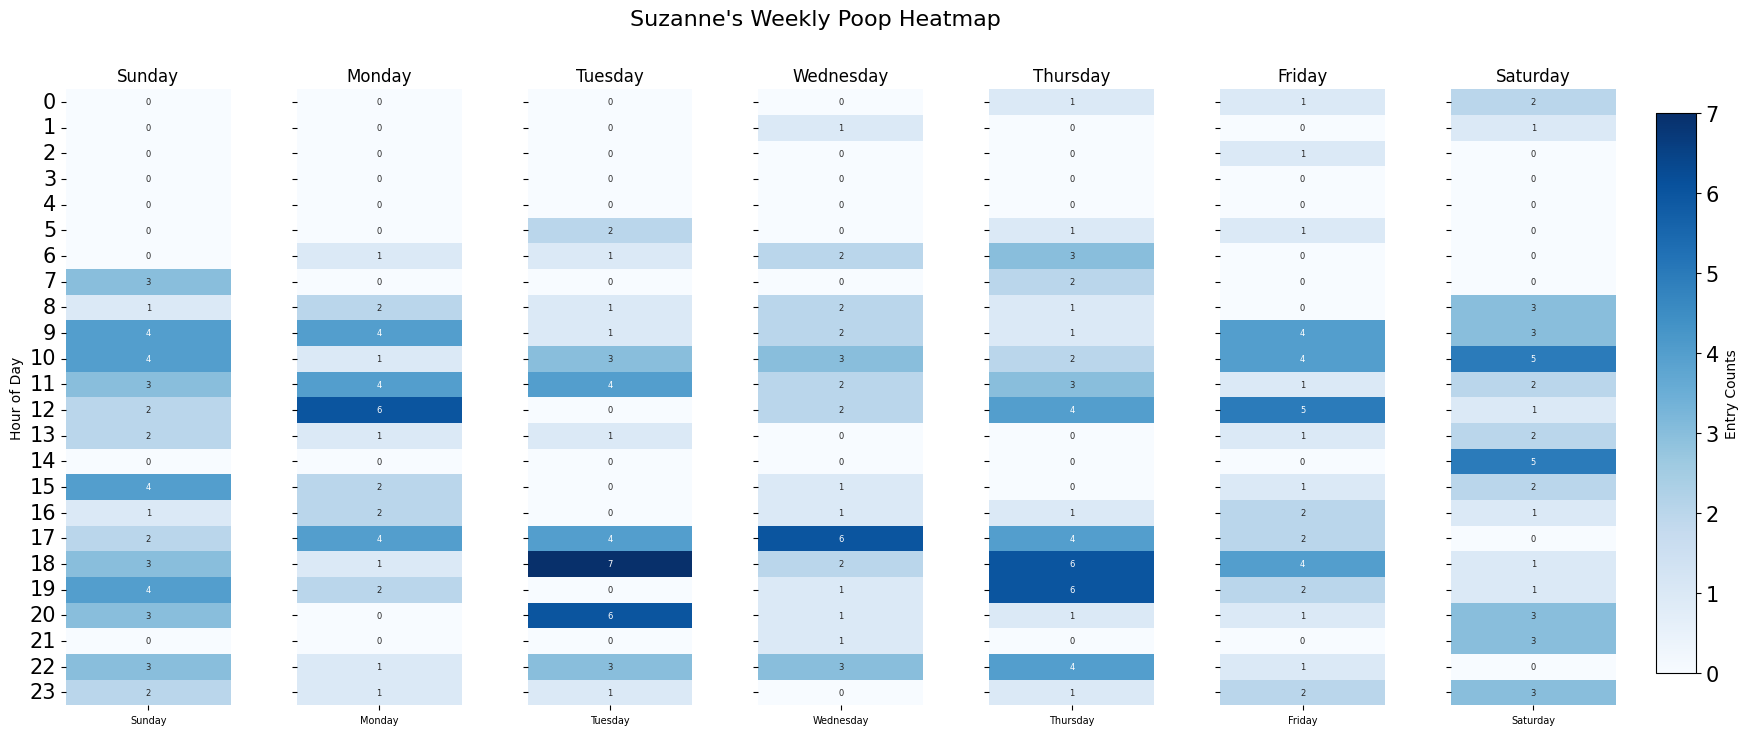
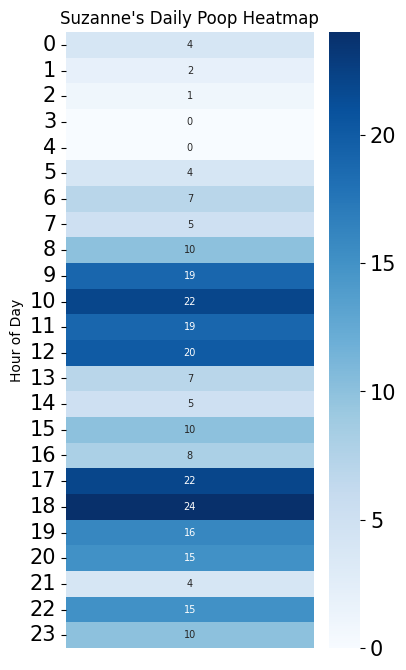
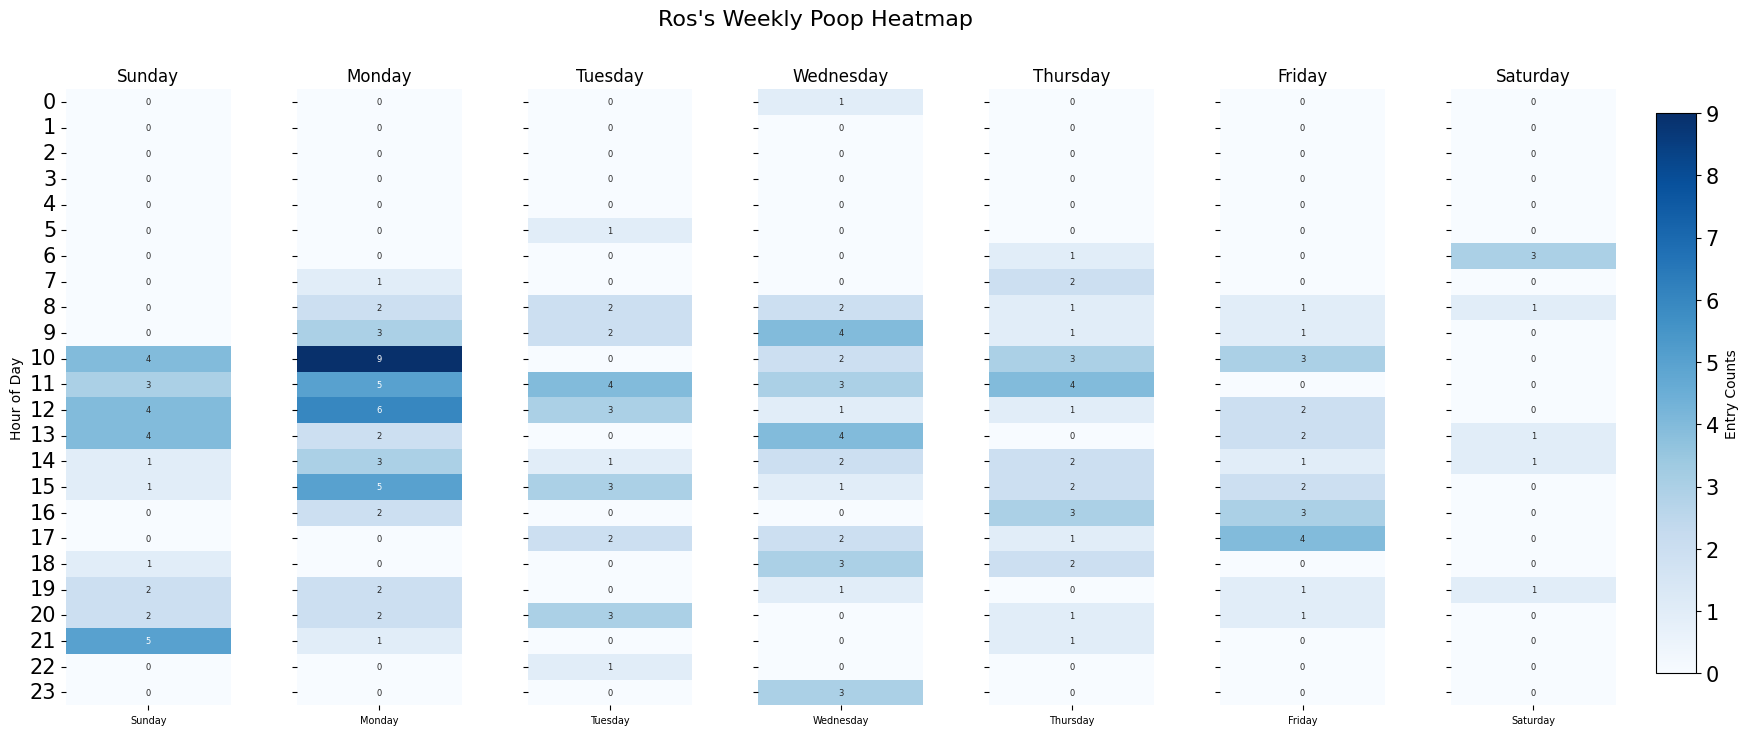
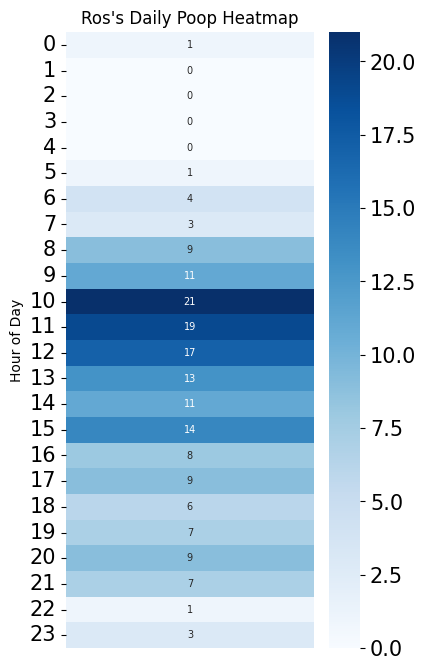
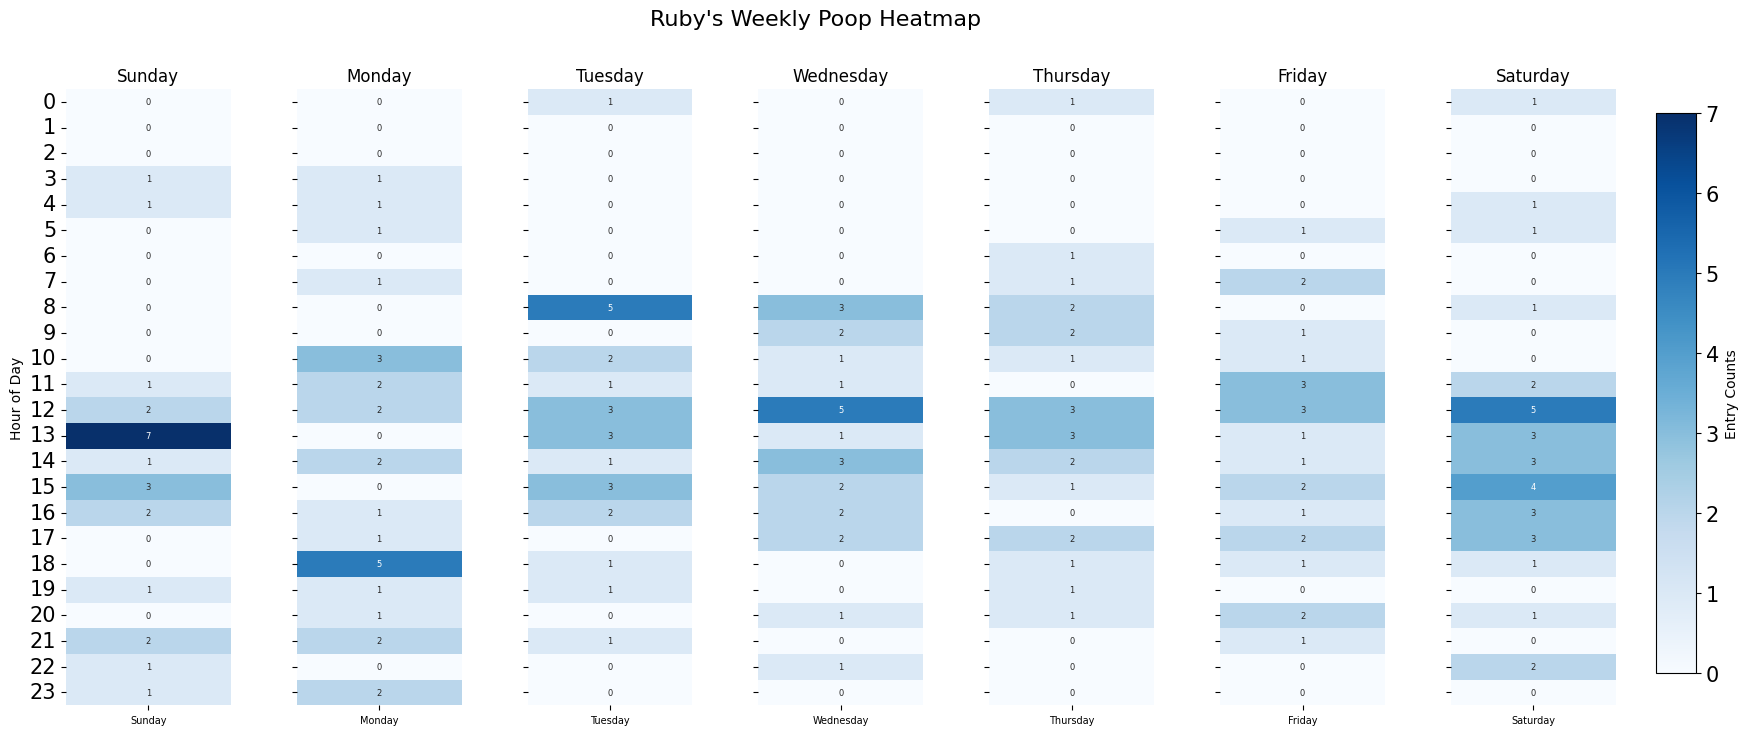
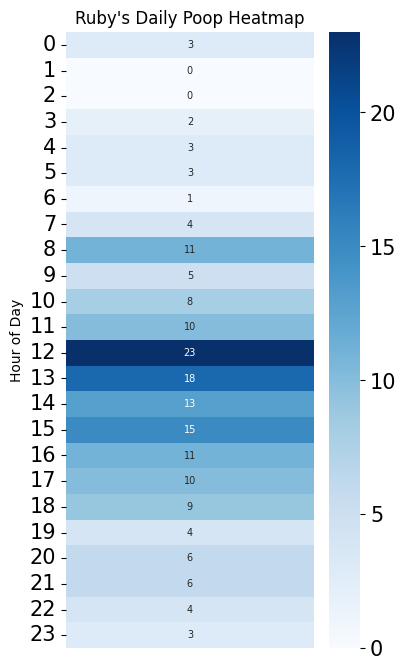
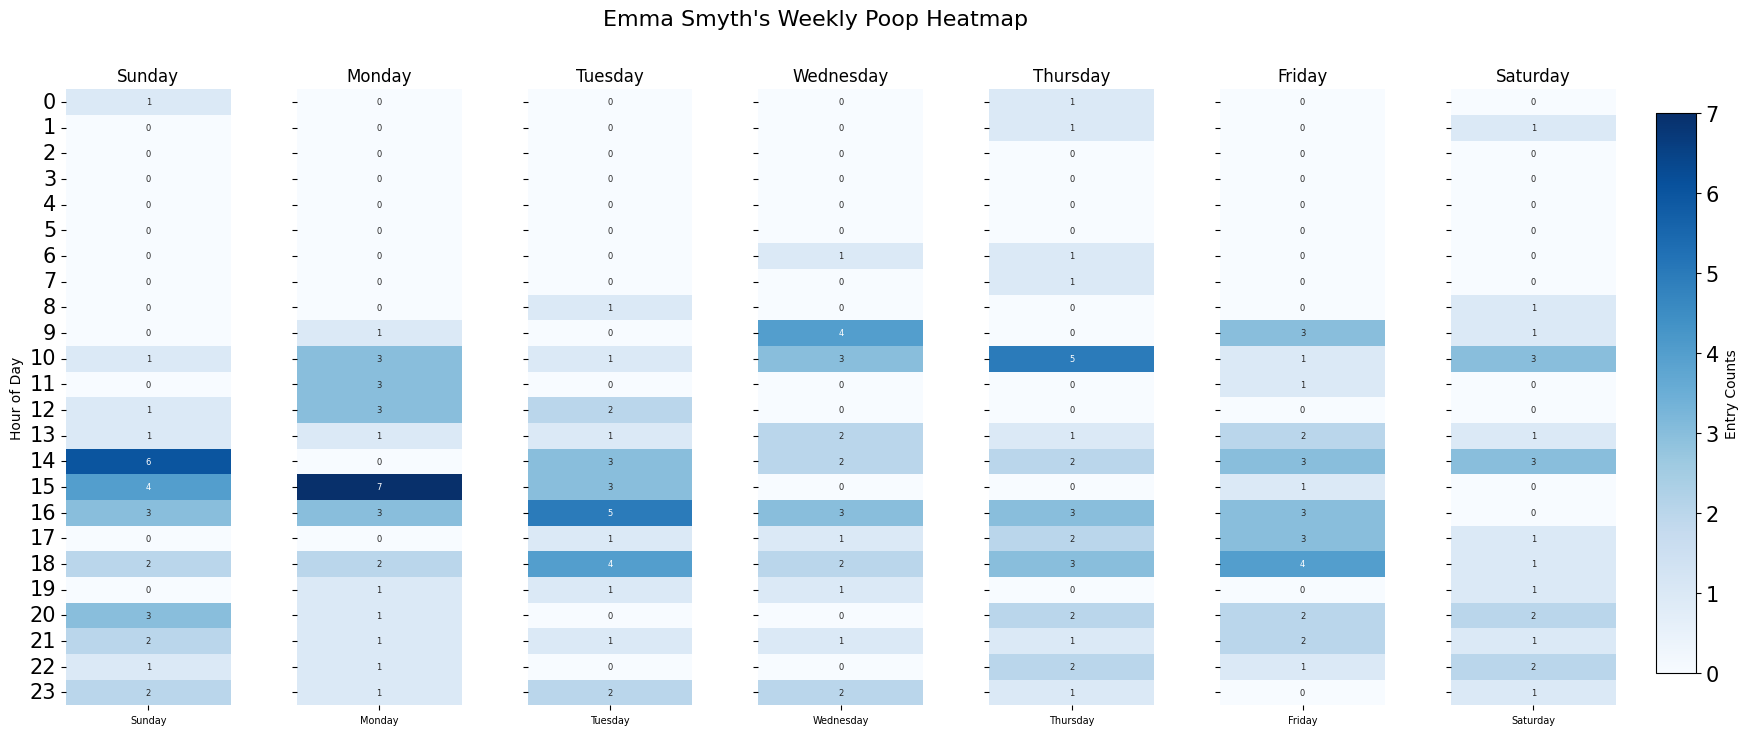
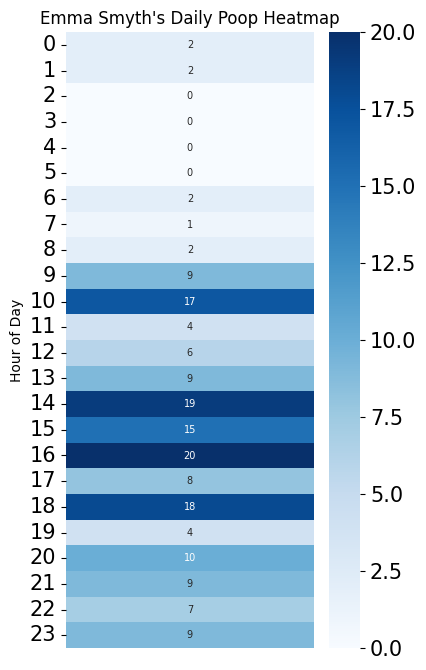
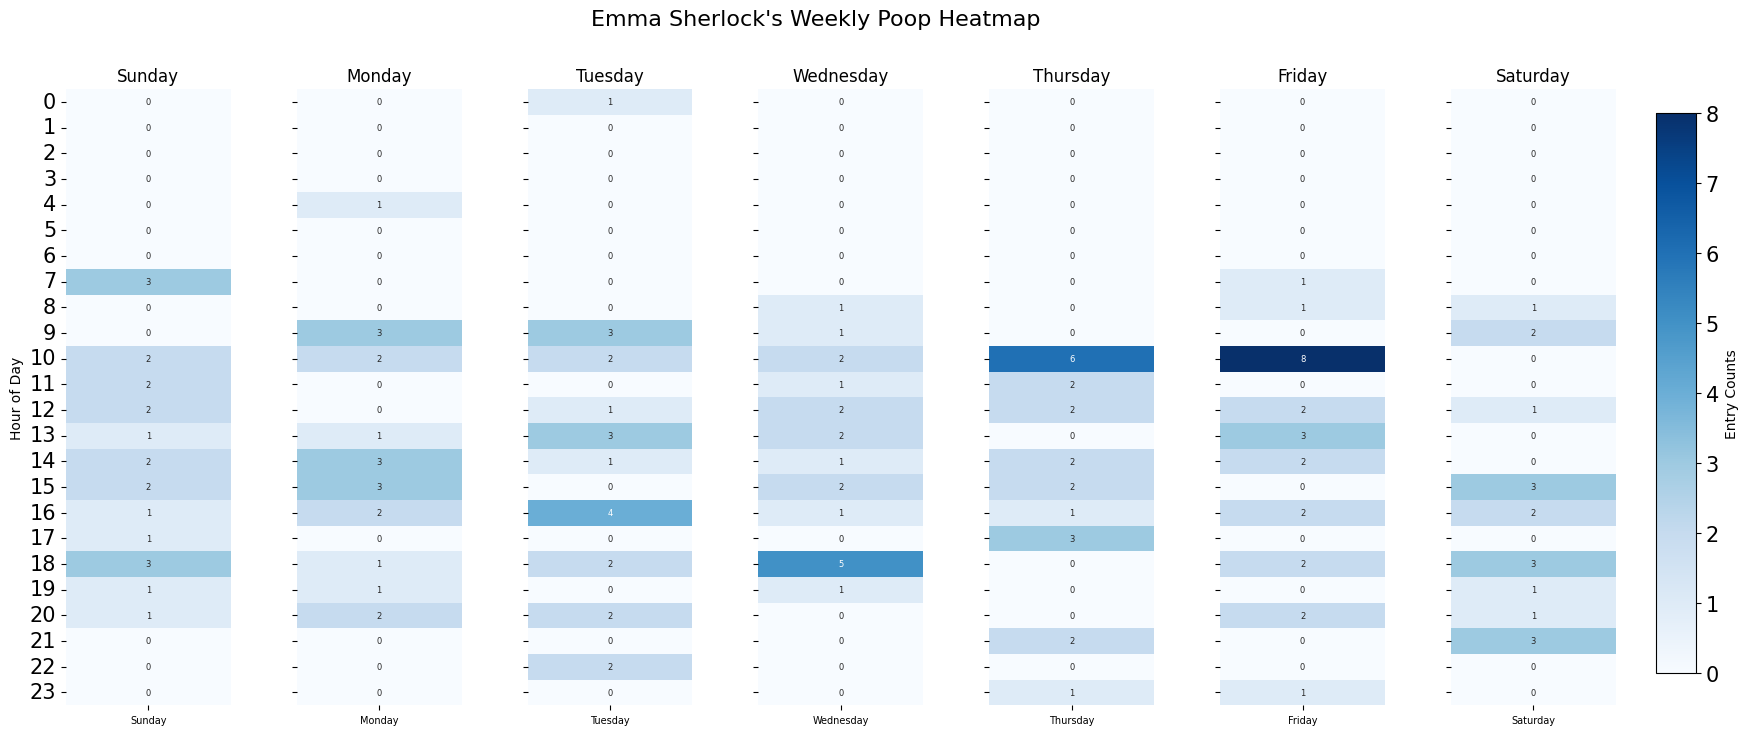
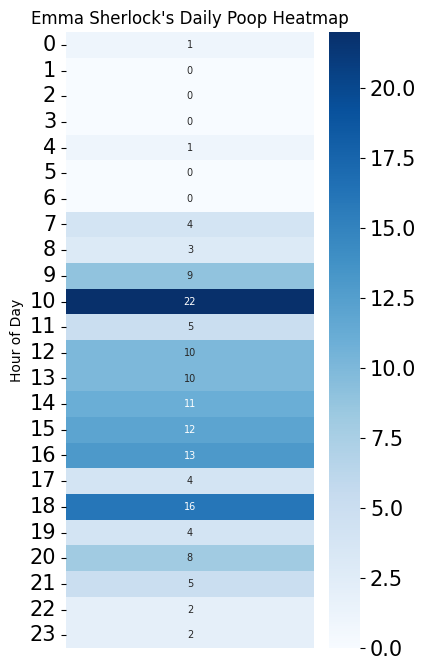
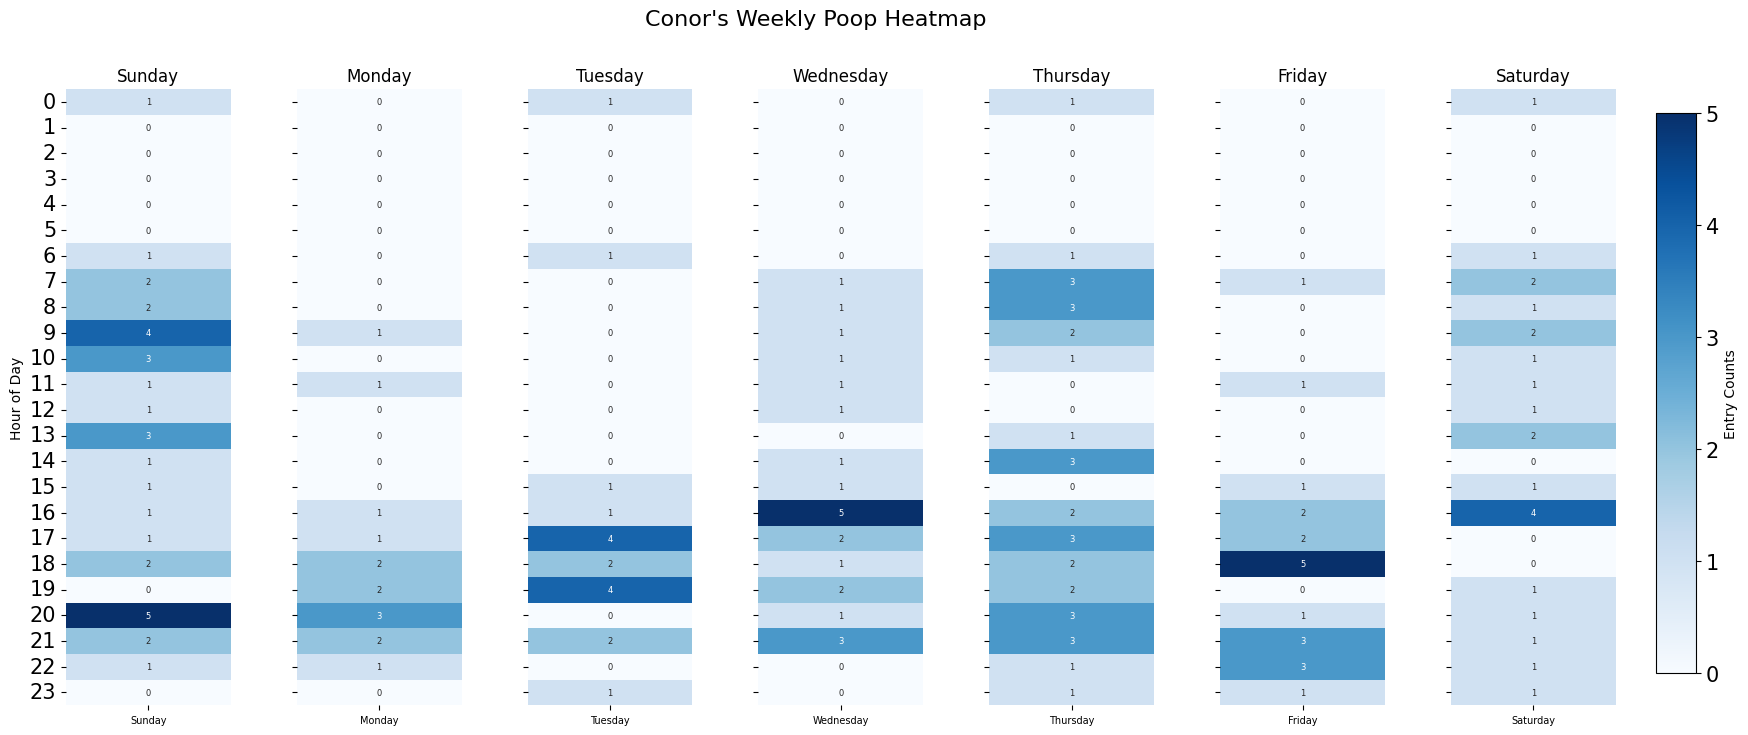
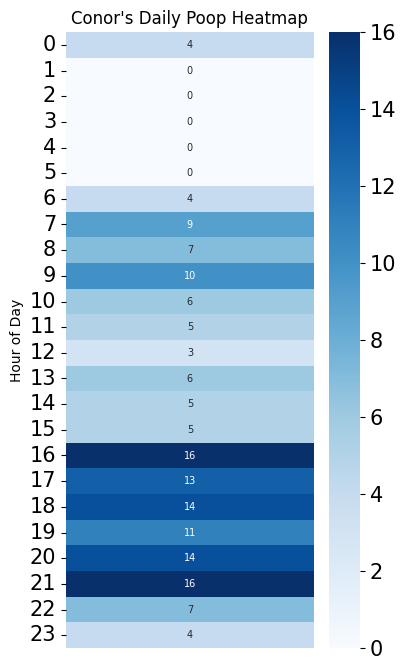
The following page displays each of our heatmaps between New Years and the end of June. The left heatmap is the number of poops taken by the user at each hour of each day throughout the year. The right-hand heatmap collapses the week into a single day representing the number of poops taken at each hour of the day. This can be representative of how regular we all are, but may also show revealing habits; hangover poos, work poos, night poos etc. If on a mobile device it may be easier to read if you rotate your phone horizontally.

Stephen Allen

Conan Davis

Eoin Brereton

Niamh Feet

Shane Bryan

Daniel Griffin

Seán Condren

Dexter Finegan

Harry Rooney

Suzanne Jones

Ros Cutiepie

Ruby Long

Emma (EKS) Smyth

Emma Sherlock

Conor Mcminiman

Katie Long

Georgia Rae

Soumia Slowpoke